email :
If you wish to receive our newsletters on a regular basis via your e-mail address instead of US Mail, please send your e-mail address to newsletter editor at:TBD requesting an e-mail newsletter copy. This will serve to reduce newsletter printing and postage costs and allow us to divert money to other projects and initiatives.
You may also select any of the listed newsletters at the left and either down-load it to your own computer or click it to open the newsletter and then print it directly from the screen.
MOAA Surviving Spouse Virtual Chapter Newsletter
June 2025 MOAA Surviving Spouse Virtual Chapter
Independence Day July 4, 2025 - MOAA Pennsylvania Council of Chapters President's Message
Other News: (submitted by G. Link)
On-going Contributions to the Veterans Hospital at Lebanon, PA
Donations to Veterans Hospital at Lebanon, PA
The hyperlink above will direct members to the VA Hospital section on volunteering and donations. The Chapter membership has historically given Clothing Items/Comfort Items as listed on the VA's website (see hyperlink and Comfort Items/Clothing section).
The VA Hospital will normally list the Comfort Items/Clothing with the greatest needs. As of September 2025 the following items are needed for donation:
| Deodorant Male |
| Lotion - Male |
| Hairbrushes |
| Sensitive Skin Dove Body Wash |
| Male Body Wash (very low stock) |
| Male 3-In-1 Body Wash (very low stock) |
| Alcohol Free Mouthwash |
| Denture Adhesive Small Tubes |
| Mens 4X T-Shirts |
| Mens 4X Underwear-Briefs (none in stock) |
| Mens Medium T-Shirts (very low stock) |
| Baby Powder (Large Size Only) |
| Women's Bras (small size) |
Veterans Day 2025: November 11
Veteran Population
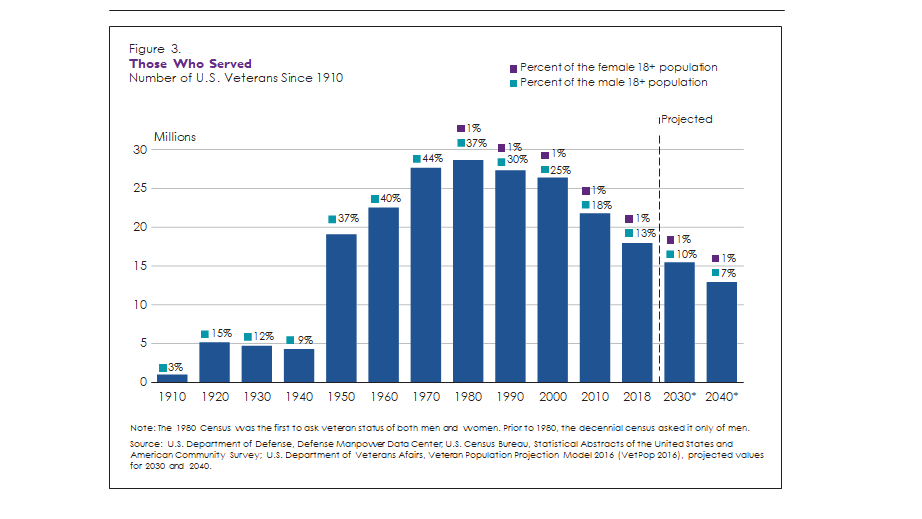
15.7 million
The number of military veterans in the United States in 2024, representing 5.9% of the total civilian population age 18 and over.
1.7 million
The number of female veterans in the United States in 2024, representing 11.1% of the total veteran population.
0.4%
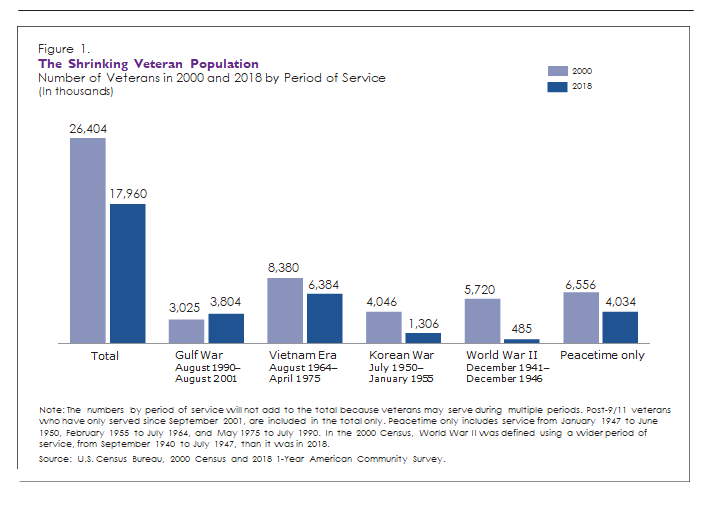
The share of veterans in 2024 who served during World War II. Additionally, 2.9% of veterans served during the Korean War; 31.3% during the Vietnam War; 25.5% during the Persian Gulf War; and 29.9% during the Post-9/11 period (September 2001 to present).
9.2%
The percentage of veterans in 2024 who were Hispanic or Latino (of any race). Additionally, 70.9% of veterans were White alone (not Hispanic or Latino); 13.0% Black or African American alone; 2.2% Asian American alone; 0.8% American Indian or Alaska Native alone; 0.2% Native Hawaiian or Other Pacific Islander alone; and 2.8% Some Other Race alone. The percentages include only those who reported a single race.
29.1%
The share of veterans 75 and older in 2024. At the other end of the spectrum, 8.4% of veterans were under age 35.
Source:
B21001: Sex by Age by Veteran ... - Census Bureau Table
for Lancaster County, PA (population 18 years of age and older)
| Lancaster County, Pennsylvania | |||||
| Label | Estimate | Margin of Error | Estimate | Margin of Error | |
| Total: | 435,018 | ±95 | |||
| Veteran | 24,403 | ±2,636 | |||
| Nonveteran | 410,615 | ±2,640 | |||
Male:
|
210,764 | ±95 | Female: | 224,254 | ±3 |
| Veteran | 22,151 | ±2,439 | Veteran | 2,252 | ±807 |
| Nonveteran | 188,613 | ±2,443 | Nonveteran | 222,002 | ±807 |
18 to 34 years |
60,190 | ±657 | 18 to 34 years: | 59,635 | ±798 |
| Veteran | 1,674 | ±877 | Veteran | 95 | ±128 |
| Nonveteran | 58,516 | ±1,029 | Nonveteran | 59,540 | ±806 |
35 to 54 years:
|
65,471 | ±657 | 35 to 54 years: | 66,338 | ±798 |
| Veteran | 3,962 | ±1,054 | Veteran | 1,082 | ±541 |
| Nonveteran | 61,509 | ±1,154 | Nonveteran | 65,256 | ±1,027 |
55 to 64 years:
|
33,306 | ±369 | 55 to 64 years: | 34,589 | ±11 |
| Veteran | 2,935 | ±893 | Veteran | 595 | ±401 |
| Nonveteran | 30,371 | ±930 | Nonveteran | 33,994 | ±401 |
65 to 74 years:
|
29,980 | ±537 | 65 to 74 years: | 32,544 | ±587 |
| Veteran | 4,693 | ±947 | Veteran | 291 | ±259 |
| Nonveteran | 25,287 | ±1,038 | Nonveteran | 32,253 | ±624 |
75 years and over:
|
21,817 | ±509 | 75 years and over: | 31,148 | ±587 |
| Veteran | 8,887 | ±1,217 | Veteran | 189 | ±171 |
| Nonveteran | 12,930 | ±1,246 | Nonveteran | 30,959 | ±616 |
source: U.S. Census Bureau. "Sex by Age by Veteran Status for the Civilian Population 18 Years and Over" American Community Survey, ACS 1-Year Estimates Detailed Tables, Table B21001, 2024, |
++++++++++++++++++++++++++++++++++++++++++++++++++++++++++++++++++++++++++++++++
Percent Change in Veteran Population by State from 2000 to 2020 |
|
Source: VetPop2018 |
|
Prepared by the National Center for Veterans Analysis and Statistics,
|
|
| State | Percent Change from 2000 to 2020 |
| Alabama | -19% |
| Alaska | -6% |
| Arizona | -11% |
| Arkansas | -28% |
| California | -35% |
| Colorado | -13% |
| Connecticut | -45% |
| Delaware | -16% |
| District of Columbia | -34% |
| Florida | -19% |
| Georgia | -11% |
| Hawaii | -5% |
| Idaho | -10% |
| Illinois | -39% |
| Indiana | -30% |
| Iowa | -31% |
| Kansas | -26% |
| Kentucky | -24% |
| Louisiana | -26% |
| Maine | -29% |
| Maryland | -27% |
| Massachusetts | -42% |
| Michigan | -37% |
| Minnesota | -32% |
| Mississippi | -25% |
| Missouri | -28% |
| Montana | -17% |
| Nebraska | -26% |
| Nevada | -8% |
| New Hampshire | -29% |
| New Jersey | -48% |
| New Mexico | -21% |
| New York | -44% |
| North Carolina | -13% |
| North Dakota | -12% |
| Ohio | -34% |
| Oklahoma | -21% |
| Oregon | -24% |
| Pennsylvania | -37% |
| Rhode Island | -38% |
| South Carolina | -6% |
| South Dakota | -18% |
| Tennessee | -18% |
| Texas | -11% |
| Utah | -17% |
| Vermont | -32% |
| Virginia | -10% |
| Washington | -18% |
| West Virginia | -30% |
| Wisconsin | -31% |
| Wyoming | -18% |
| Puerto Rico | -42% |
| Island Areas & Foreign | -53% |
| Grand Total | -26.3% |


